Scripts for preparing files with detailed instructions can be downloaded from SPAR repository.
FAQ
How to analyze your own data?
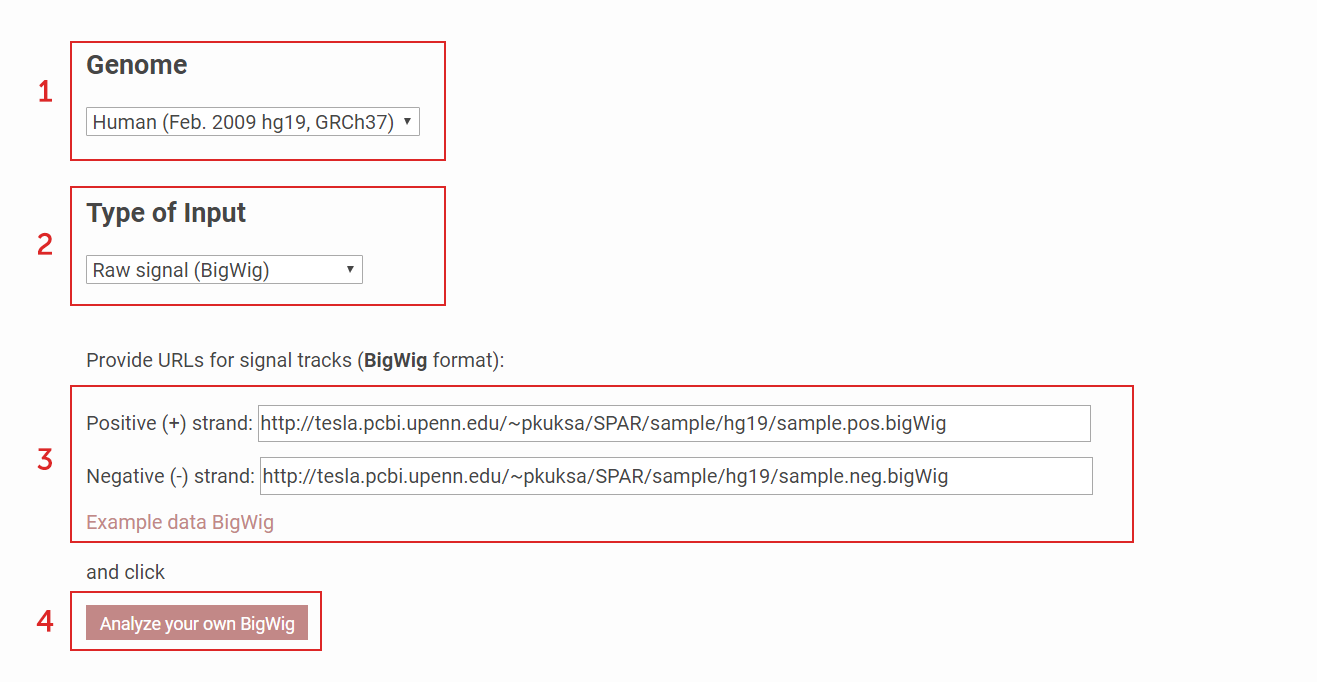
To analyze and visualize data from small RNA sequencing experiment
(1) Select the Genome Assembly version.
(2) Choose which input format the data is in (BigWig, BAM).
(3) Provide direct paths (URLs) of the two strand-specific files in the file format chosen in (2).
(4) Press "Analyze" to start processing.
Note, currently we have provided the sample data (selectable with "Example data") so user can click "Analyze" directly for processing.
Figure 1a. How to analyze your own sequencing data using SPAR
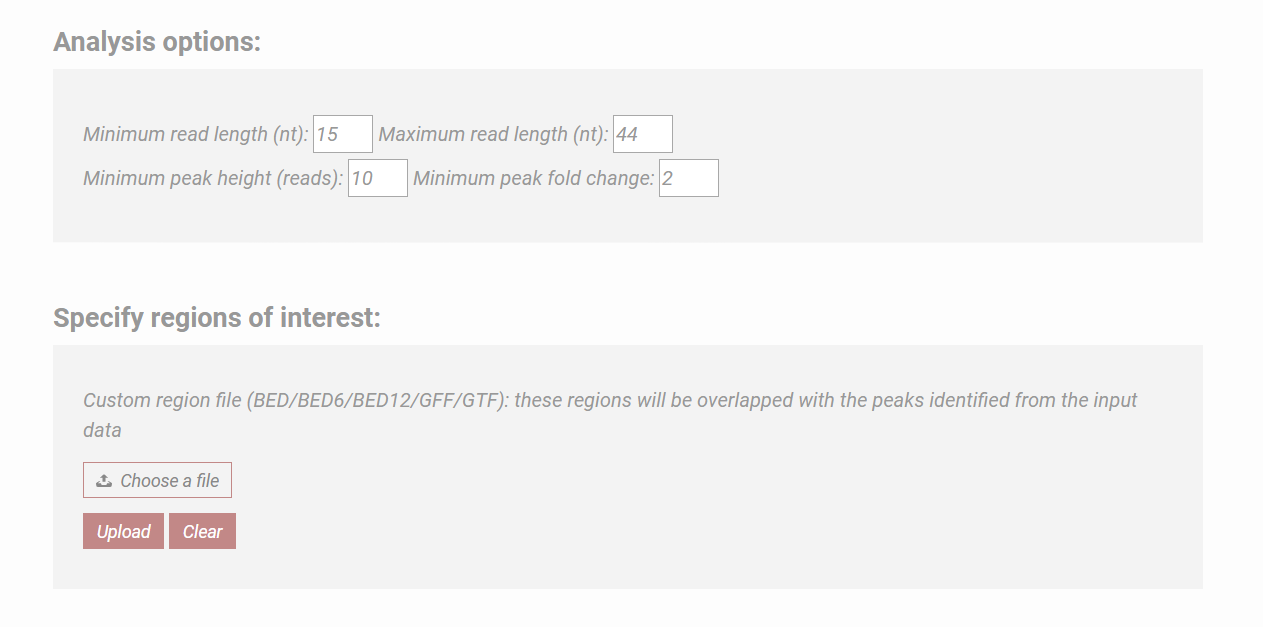
Specifying analysis parameters:
The minimum and the maximum lengths of the small RNA loci used for detection can be adjusted.
The peak detection parameters can be adjusted by the user, including the minimum number of reads required to call a peak and the minimum change in the read accumulation relative to the background
Specifying target genomic regions:
In addition to the analysis of the RNA loci genome-wide, SPAR provides users with the flexibility to focus on specific genomic regions.
Users can upload a file containing the regions of interest.
SPAR will output results that are specific to these regions (under "Custom annotation summary" section), thus enabling users to perform targeted analysis.
Figure 1b. Analysis options
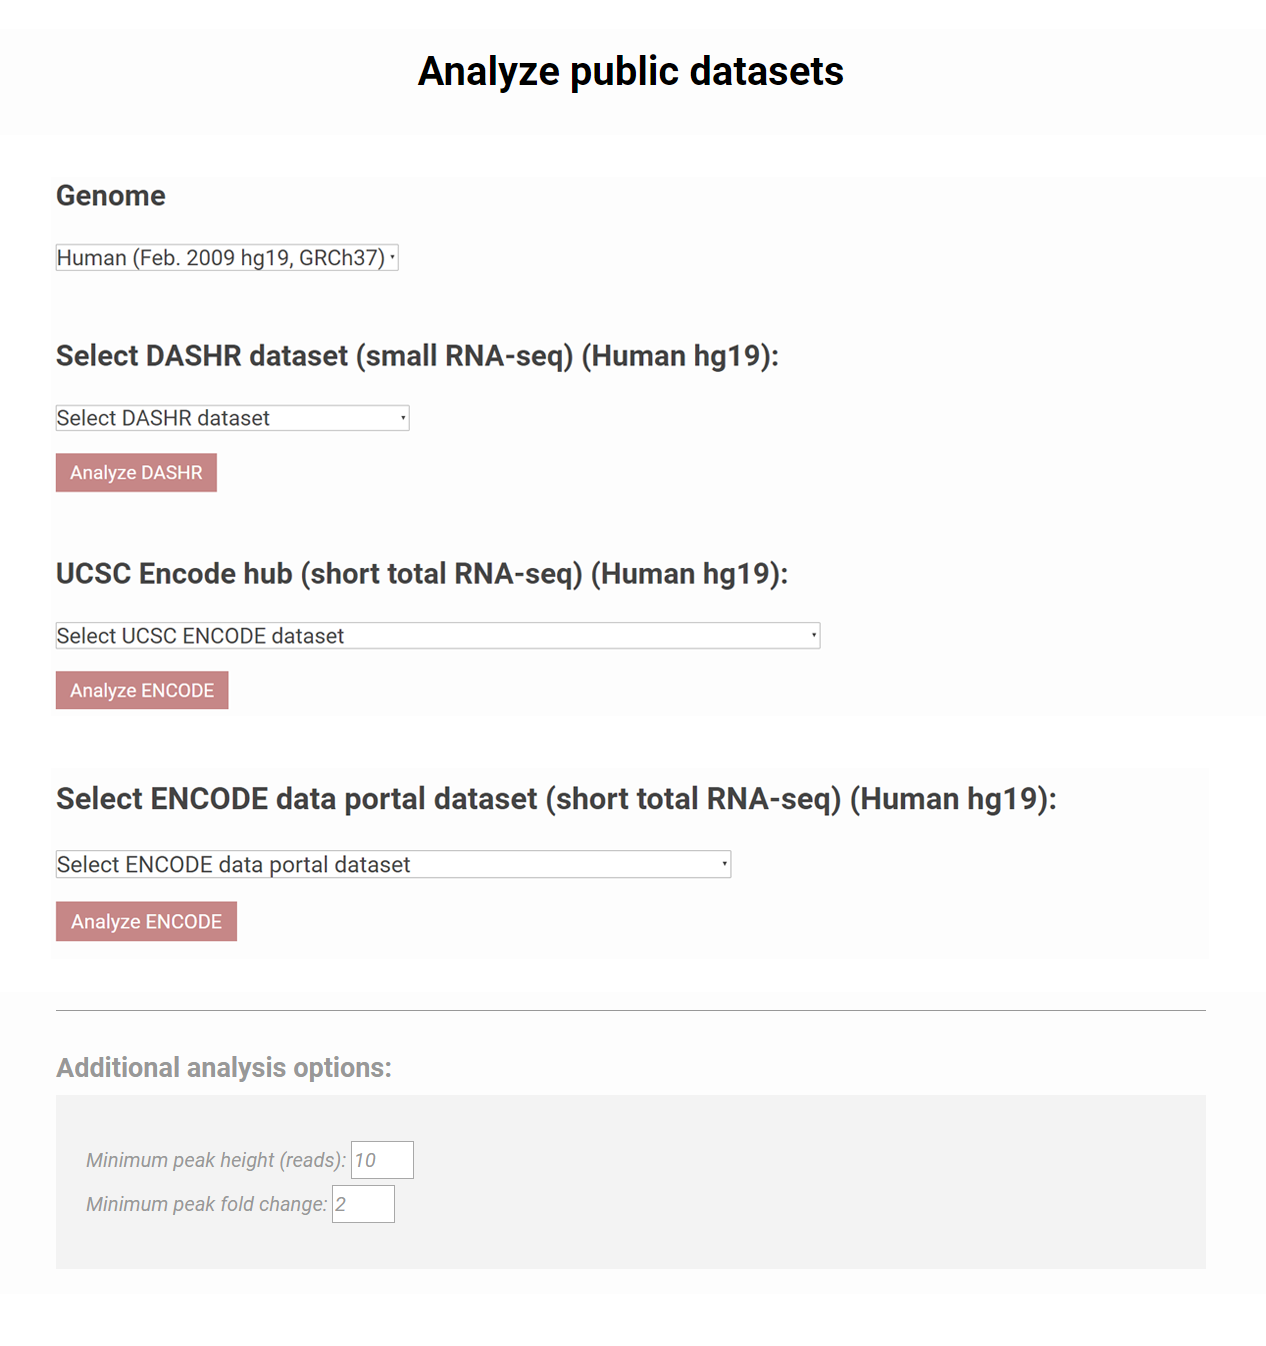
How to analyze ENCODE or DASHR datasets?
Besides analyzing users' own data, >200 public small RNA seq datasets have been linked to SPAR. Users can choose from the list of data in DASHR and ENCODE by clicking the drop down menu to start the job. Additional analyses options for calling peaks are available at the bottom of the page.Figure 2. SPAR can be used to analyze public datasets from DASHR and ENCODE
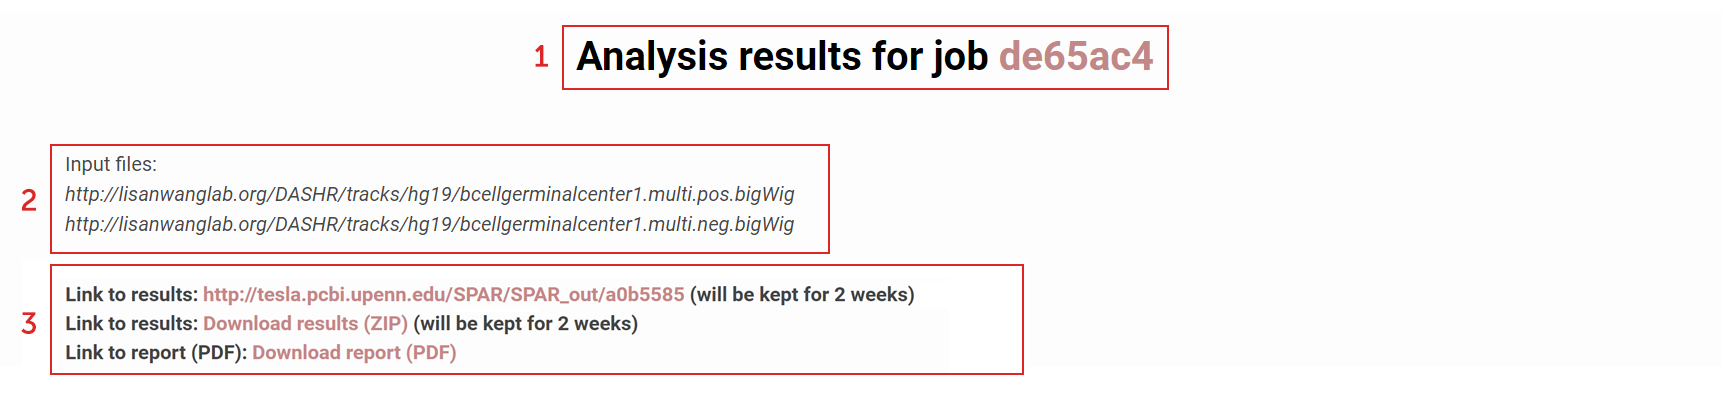
How to download analysis results in a single file?
Links to the output returned by SPAR:
(1) A job ID will be generated when SPAR initiates analysis of the input experiment. This is used to keep every user’s submitted data private and not viewable by others.
(2) The input files corresponding the experiment submitted for analysis used are displayed at the top of the report page.
(3.1) SPAR analysis results for the submitted experiment are accessible via a web folder corresponding to the generated job ID.
(3.2) Users can also download all results in a single file (ZIP format).
(3.3) A report (PDF) with the summary of the analysis results is available for the user to view/download.
(3.4) SPAR analysis results will be kept in the SPAR server for up to 2 weeks.
Figure 3. Links to the output returned by SPAR
How to monitor progress for the submitted job?
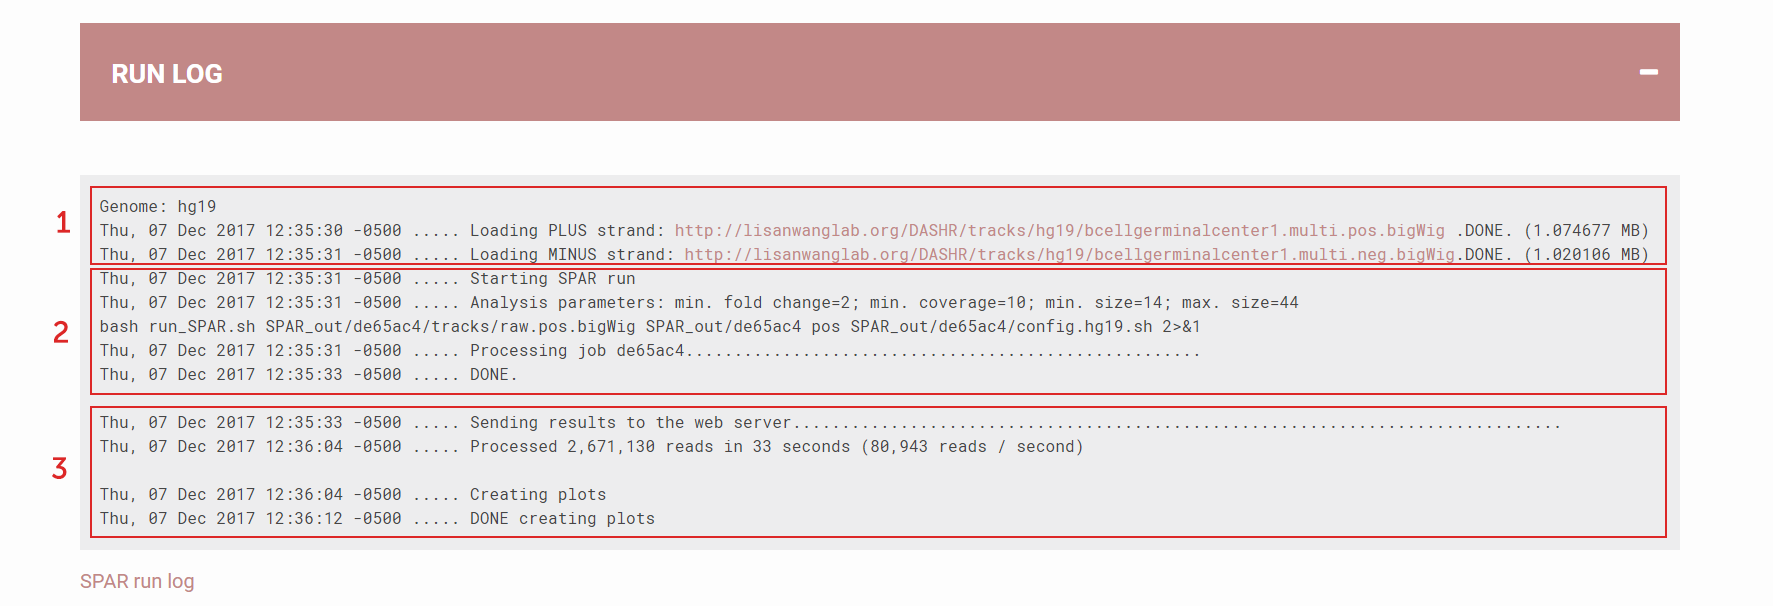
Run Log showing details of the SPAR job execution:
(1) Preparation: load genome build information and download data
(2) Processing details: time stamp showing when SPAR starts and ends; what are the parameters selected for this run; what is the job ID.
(3) Generating results: speed of processing, time used to generate plots for visualization
Figure 4. Run Log showing details of the SPAR job execution
How to assess data/results quality?
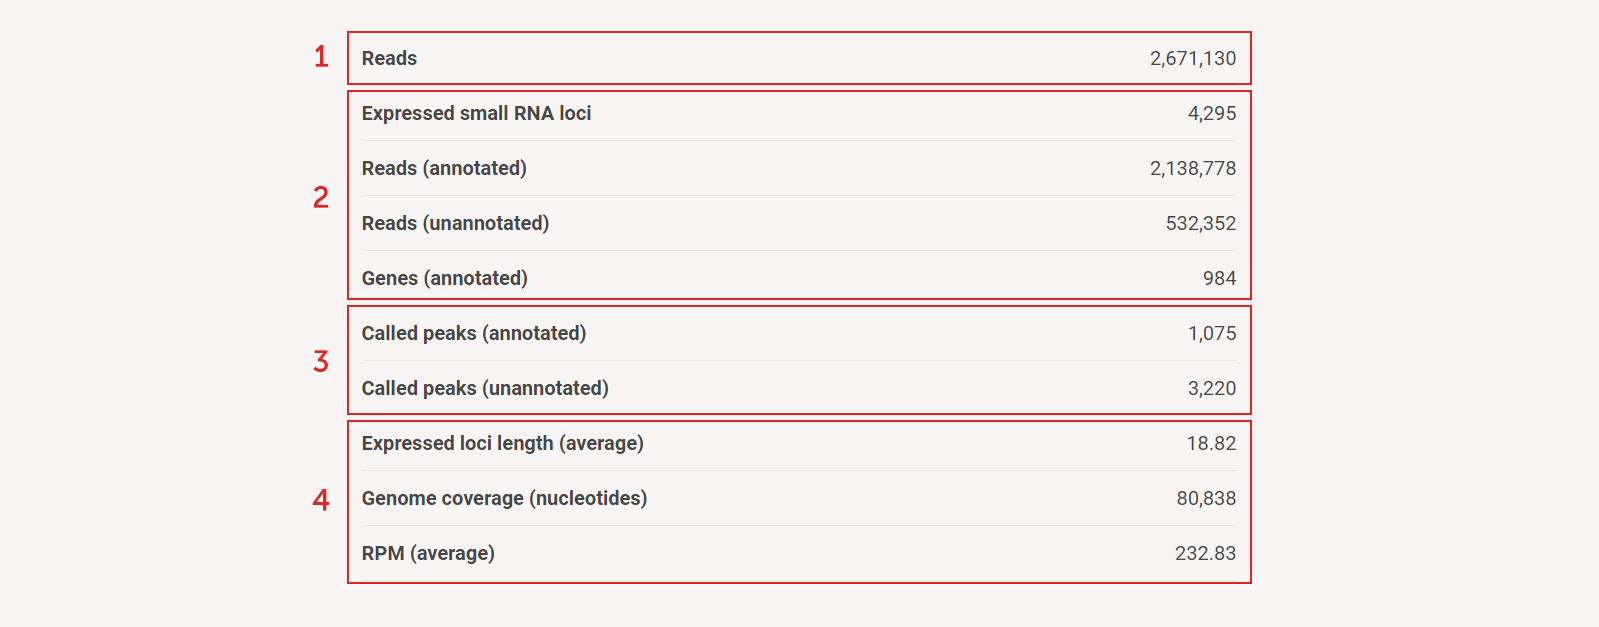
Run summary table highlights major SPAR results:
(1) Total number of processed reads
(2) Details of small RNA loci
(3) Details of called peaks
(4) Other important information for user to judge the quality of data: average loci length, genome coverage, expression (RPM)
Figure 5a. Run summary table highlights major SPAR results
Figure 5b. Summary Charts of run SPAR results
How to view, sort, filter, and download small RNA loci using Interactive peak browser?
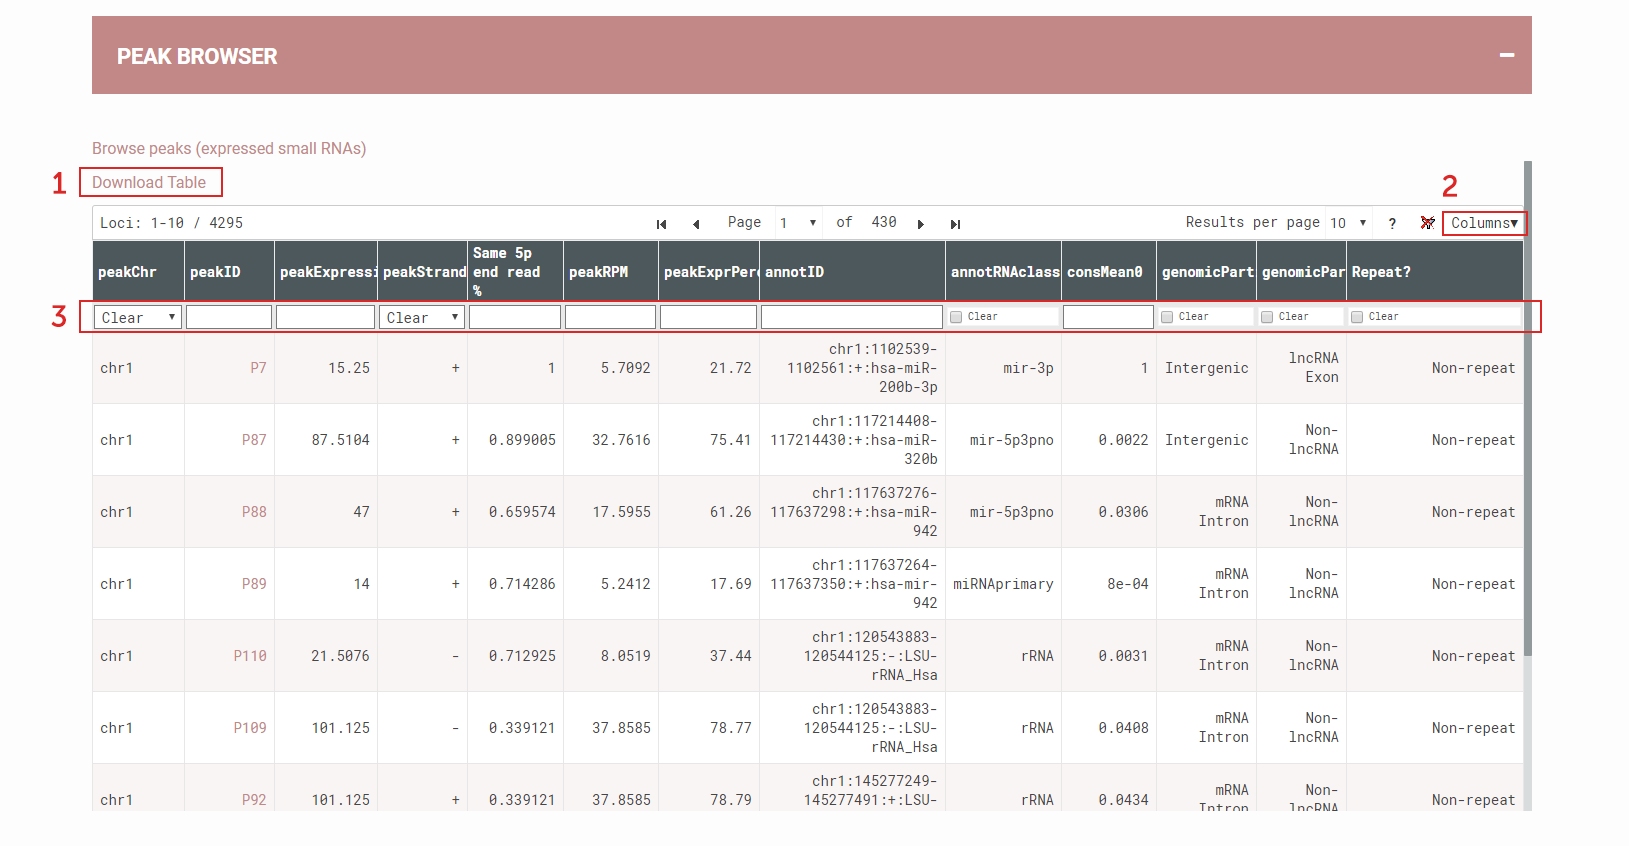
Interactive Peak Browser for dynamic view of the SPAR results:
(1) All data is available for download; Or users can first perform filtering before clicking the download button. Only the filtered loci will be downloaded in this case.
(2) Users can hide or select more columns to view and filter
(3) Users can filter results by click box, e.g. by small RNA class; or users can filter by numerical values (e.g., <0.1, ≥100) or categories (e.g., hsa-mir, U2).
Figure 6. Interactive Peak Browser for dynamic view of the SPAR results
How to view SPAR results in the Genome browser?
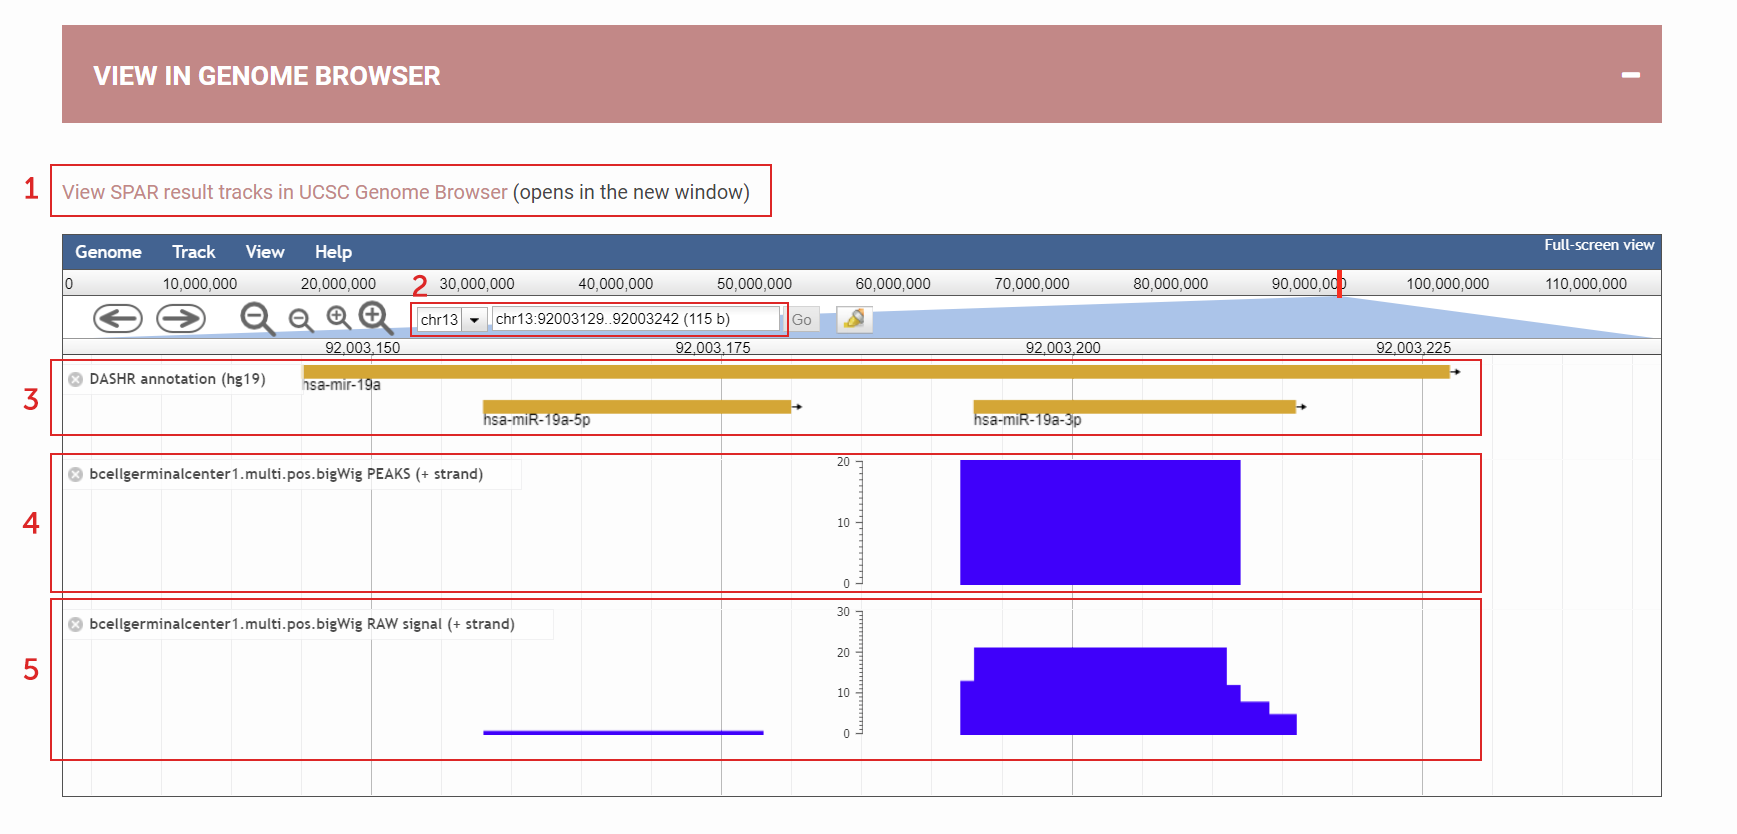
Genome Browser for viewing SPAR results:
(1) User can choose to view the processed SPAR results in UCSC genome browser instead – so they can compare the results with other tracks
(2) Type in genomic coordinates / gene names / small RNA IDs
(3) Annotation
(4) Called peak track shows how peaks are called
(5) Raw signal track shows how reads align (raw coverage)
Figure 7. Genome Browser for viewing SPAR results
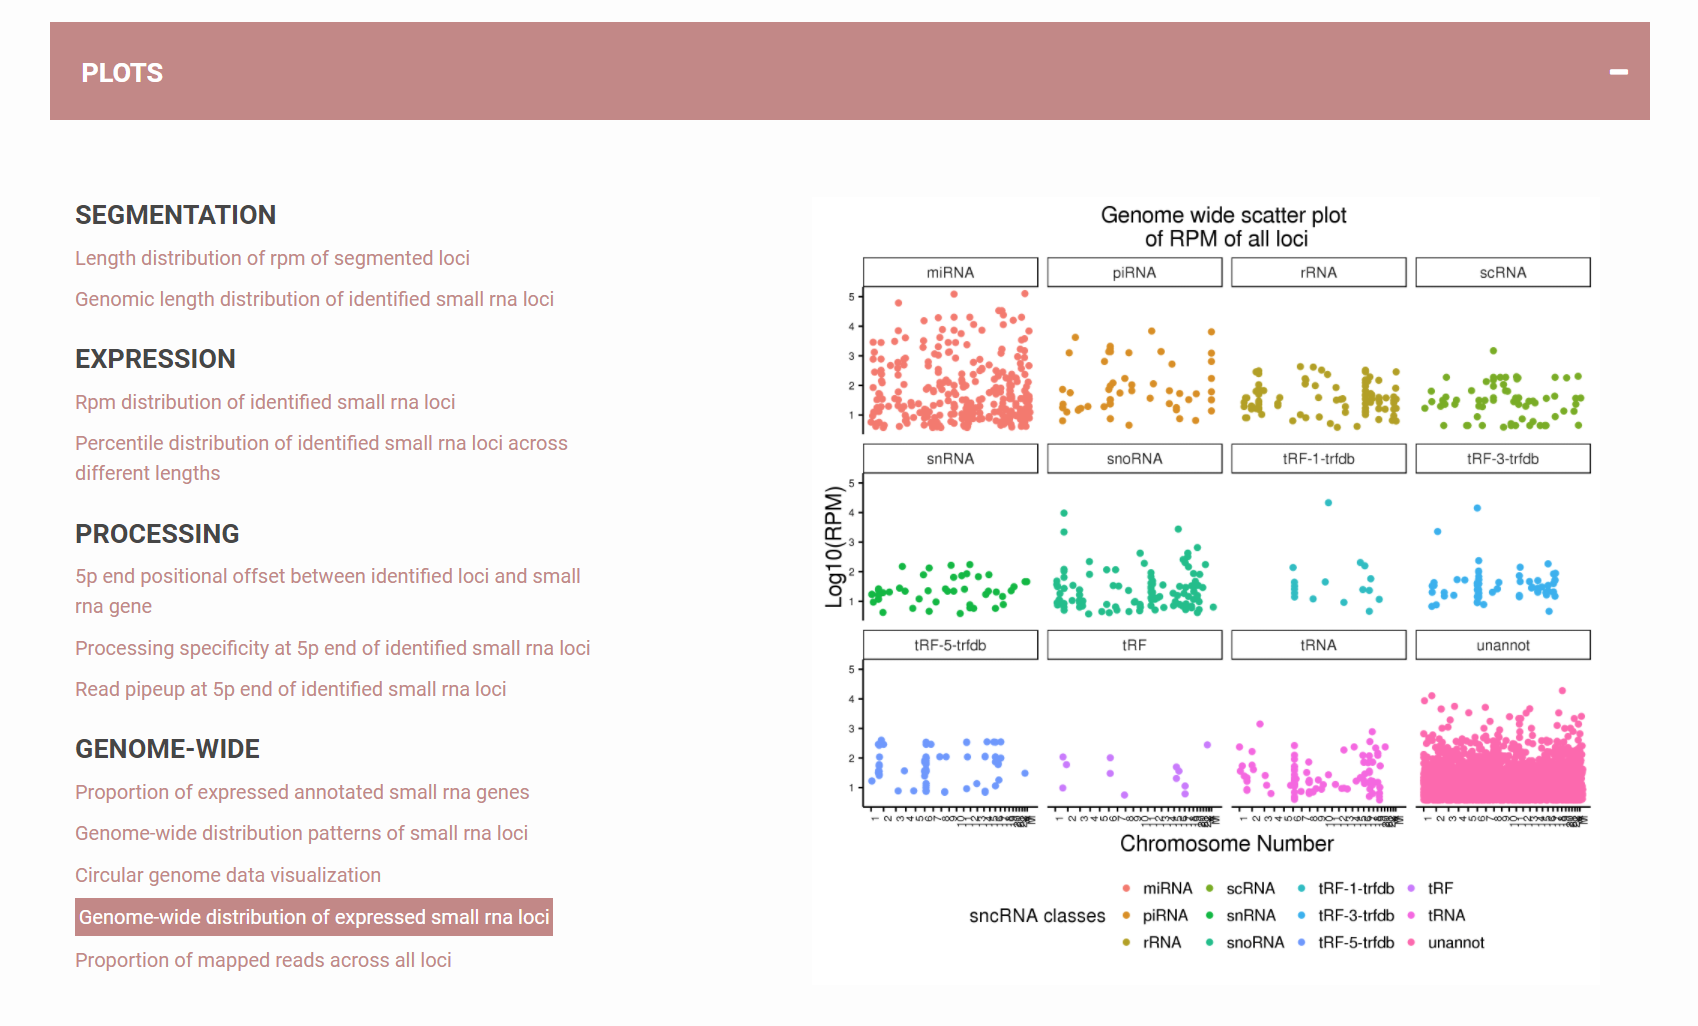
How to view analysis results as plots?
Besides tables, users can also quickly access the quality of their data by looking at the plots SPAR provide. All plots are available for download as well. These include (1) SEGMENTATION – length of the called loci ; (2) EXPRESSION – number of reads each locus has; (3) PROCESSING – specificity of the processing as reflected by the locus pattern; 4) GENOME-WIDE – genome wide properties of the RNAs present in the data.Figure 8. SPAR results available in plots
How to download results by RNA class?
High level summary of the SPAR results broken down by small RNA classes. Users can evaluate immediately the quality of the sequencing data by e.g. (1) percentage of reads that map to a specific RNA class and (2) how many called small RNA loci. Users can (3) select the classes they are interested to download, or they can select the annotated / unannotated loci for further study.Figure 9. SPAR results – summarize and download
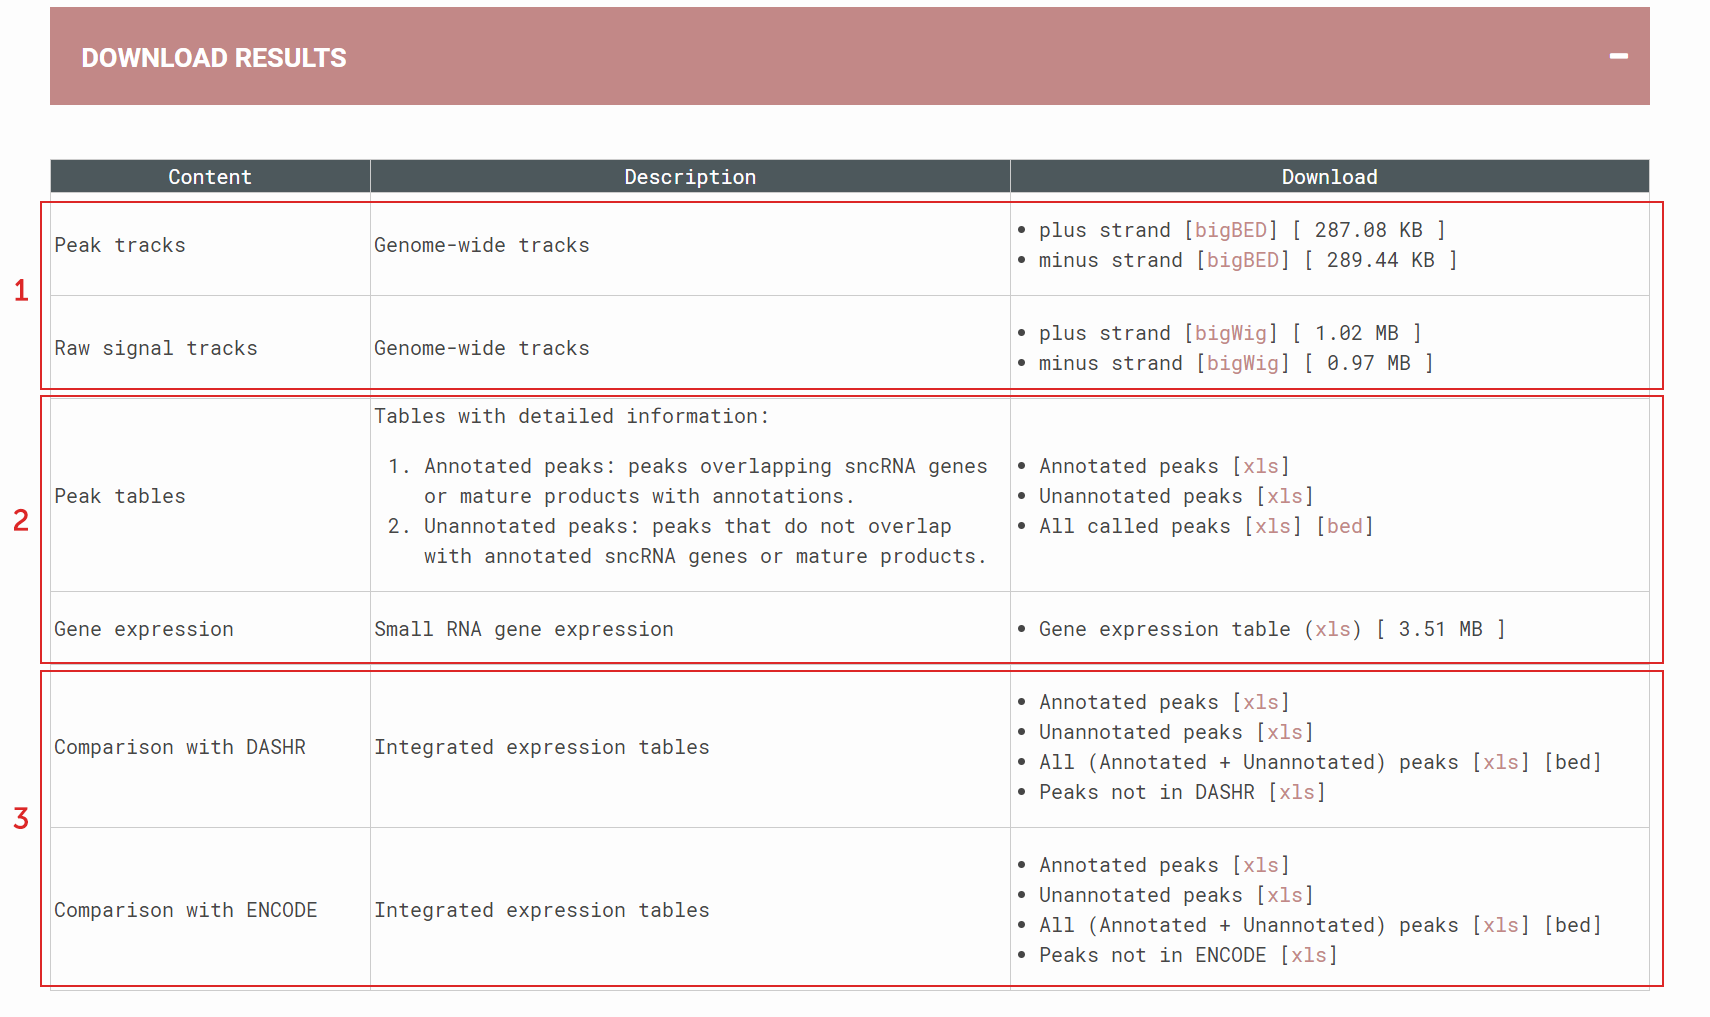
How to download full results?
All SPAR results are shown in this table, including
(1) genome browser tracks – users can download these and put into their favorite genome browser and compare with other results very efficiently.
(2) peak tables – users can learn more about all the features SPAR provides for each of the processed loci.
(3) Integrated comparison expression tables - If users choose to process their own data, this table will contain the complete SPAR results of the data, appended with the expression values of all the tissues / cell types in DASHR / ENCODE. In this way, users can easily compare their own data with existing publicly available data in an unbiased manner as all data are processed in exactly the same way. One potential use case for this is to identify biomarkers from their samples.
Figure 10. Download comprehensive SPAR results